
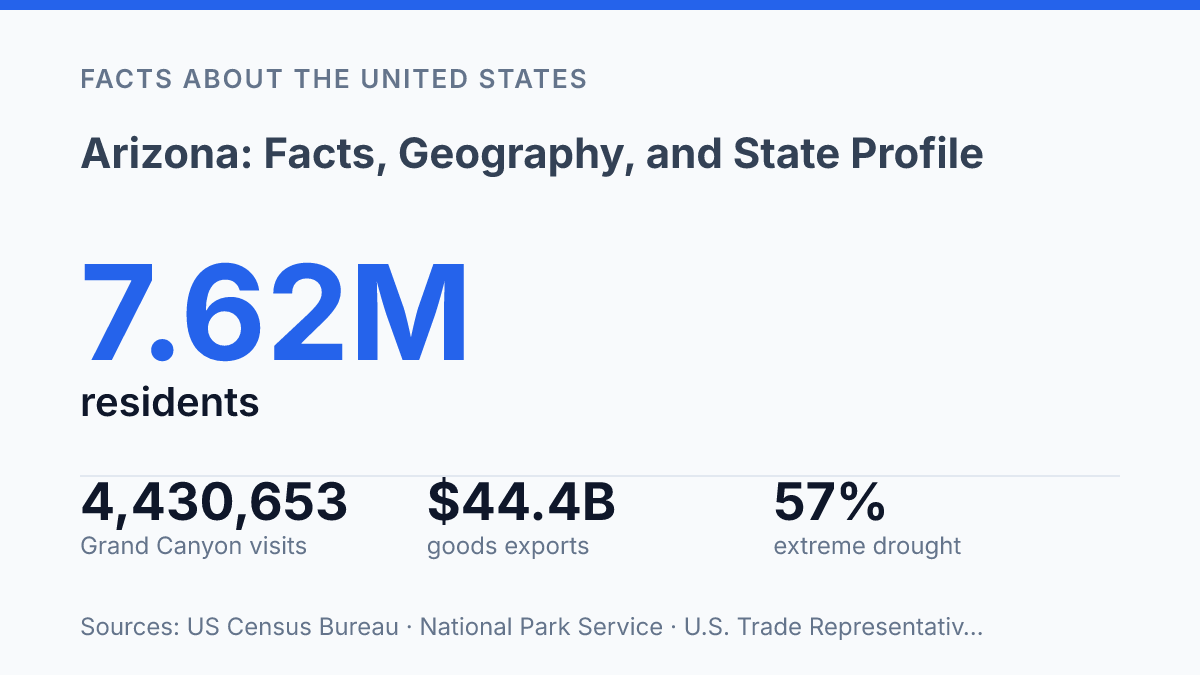
Arizona compresses one of the sharpest climate gradients in the United States into a single state: Yuma averages about 3 inches of annual precipitation, while the White Mountains can receive around 40. That contrast is not trivia; it explains why water supply, settlement, industry, and transportation follow such uneven patterns across the state. The pressure is current, not theoretical: in May 2025, statewide moisture stood at only 38% of long-term precipitation, and extreme drought covered 57% of the state.
At the same time, population and capital continue to concentrate around Phoenix, where Maricopa County reached nearly 4.8 million residents in 2025. The state profile that follows is therefore less a catalogue of facts than a map of constraints and advantages: heat and elevation, dense metro growth and remote land, semiconductor exports and Mexico-linked trade, iconic landmarks and hard resource limits.
Where Arizona sits and what shapes its climate
A drive from the lower Colorado River corridor to the White Mountains can cross a precipitation gradient from near-desert minimums to forested high-country totals within one state. According to the Arizona State Climate Office, accessed 2026, average annual precipitation ranges from about 3 inches in Yuma to around 40 inches in the White Mountains, while southwestern desert summer daytime temperatures average 105°–115°F.
That spread is not a weather anomaly. It is the direct result of latitude, terrain, elevation, and the state’s position between subtropical desert air and higher interior plateaus.
The state occupies the Southwest borderland, touching California and Nevada to the west, Utah to the north, New Mexico to the east, and Mexico to the south. The Colorado River forms much of the western edge and functions as more than a boundary line; it defines low-elevation desert valleys, cuts major canyon systems, and anchors the state’s most visible contrast between arid basins and elevated terrain. This geography places dry lowlands close to high plateaus and mountain blocks, which compresses climate variation into comparatively short distances.
Three physical regions explain much of that variation. The Sonoran Desert dominates the south and southwest, where low elevation, intense solar heating, and dry air produce long hot seasons.
The Colorado Plateau covers much of the north and northeast, where higher elevations moderate summer heat and allow colder winters. In southern mountain ranges, the Sky Islands rise abruptly from desert basins, creating cooler, wetter habitats above arid floors; the term reflects ecological separation as much as topography.
Elevation is the controlling variable behind the state’s strongest temperature contrasts. Phoenix sits in the low desert, so heat accumulates efficiently and nights can remain warm after severe daytime heating. Flagstaff, by contrast, lies near 7,000 feet on the Colorado Plateau, which lowers average temperatures enough to support winter snow and much cooler summer nights.
Higher mountain areas intensify the pattern, proving that the state’s climate cannot be reduced to desert heat alone. The better reading is vertical: altitude repeatedly overrides latitude, turning a hot-state stereotype into one of the country’s sharper internal climate gradients.
Population, major cities, and how people are distributed
Nearly two-thirds of the state’s residents now live in a single county, a concentration that makes population growth as much a metropolitan story as a statewide one. The U.S. Census counted 6,392,017 residents in 2010 and 7,151,502 in 2020, a gain of 759,485 people over the decade. That 11.9% increase was large enough to reinforce Arizona’s status as one of the faster-growing states, but its practical effect was uneven: growth added pressure and political weight most clearly where people were already clustered.
Phoenix remains the dominant urban center, both as the largest city and as the anchor of the state’s principal metropolitan area. As of July 1, 2025, Phoenix had 1,709,489 residents, while Maricopa County had 4,787,790 people, according to MAG, the Arizona State Demographer, and Census-based sources.
Against a statewide estimate of 7,623,818 residents from U.S. Census Bureau QuickFacts for July 1, 2025, Maricopa County alone accounted for about 63% of the population. That scale changes the meaning of statewide growth: new housing, transportation demand, school capacity, and municipal services are disproportionately shaped by decisions in and around the Phoenix area.
Tucson functions as the second-largest city and the main population center in southern Arizona, giving Pima County a distinct urban gravity outside the Phoenix orbit. Flagstaff, by contrast, serves as a northern regional center rather than a comparable population giant, drawing significance from its role in education, health care, transportation, and services for a wide surrounding area. The hierarchy is therefore clear: one dominant metro, one secondary city, and regional hubs that matter more than their raw population totals suggest.
This distribution creates a durable contrast between fast-growing urban and suburban communities and large rural counties with far fewer residents spread across greater distances. Rural areas may not match Maricopa County in headcount, but they still shape legislative districts, infrastructure planning, emergency response, and access to public services. The demographic consequence is a state where population is highly centralized, while governance and service delivery remain geographically broad.
Economy, industry, and cross-border trade
A record $44.4 billion in goods exports in 2025 shows that the state’s economy is no longer defined mainly by housing cycles, seasonal travel, and resource extraction. According to the Office of the U.S. Trade Representative, computer and electronic products accounted for $19.6 billion of that total, while Mexico received $14.6 billion, or one-third of all goods exports. That mix points to a production base increasingly tied to advanced manufacturing and binational supply chains rather than a narrow service economy.
Semiconductor manufacturing is the clearest sign of this shift. The Phoenix area has become a major node for chip fabrication, supplier facilities, construction labor, engineering talent, and power-intensive industrial development, with major activity tied to Taiwan Semiconductor Manufacturing Company. The economic significance extends beyond a single plant: fabrication facilities pull in chemical suppliers, precision equipment firms, logistics providers, and specialized workforce training.
The constraint is equally clear. Chipmaking requires reliable water, electricity, land, and transport access, so growth depends on infrastructure capacity as much as corporate investment.
Tourism still supplies a different kind of economic base because it exports experiences rather than manufactured goods. Grand Canyon National Park recorded 4,430,653 visits in 2025, according to the National Park Service, and that traffic supports lodging, guiding, food service, retail, transportation, and gateway-community employment.
Other national parks, monuments, forests, and recreation areas broaden that spending across regions that do not host large industrial employers. The sector is valuable because it spreads income geographically, but it remains exposed to wildfire risk, heat, staffing costs, and swings in travel demand.
Trade with Mexico gives Arizona a structural advantage that inland competitors cannot easily replicate. Nogales and other ports of entry connect produce, manufactured goods, vehicles, electronics, and components moving in both directions, while Interstate 10 and Interstate 8 carry freight between Southern California, Phoenix, Tucson, Texas, and border corridors.
The result is an economy shaped by proximity: factories, warehouses, customs brokers, cold-chain operators, and trucking firms all benefit when cross-border movement is efficient. Diversification is real, but it is bounded by water access, land-use decisions, permitting speed, and dependence on national and international supply networks.
State symbols, landmarks, and facts that define Arizona
The official identifiers most associated with the state point to the desert, but that shorthand leaves out the forests, high plateaus, and alpine settings that also define its physical profile. Phoenix is the capital, and the state entered the Union on February 14, 1912, as the 48th state. Those concise facts anchor most state profiles because they fix both the seat of government and the state’s place in the national order without requiring a longer historical account.
Its best-known landmarks reinforce a strong visual identity. The Grand Canyon remains the signature natural feature, not merely because of scale but because it has become the primary geographic reference by which many people recognize the state.
Saguaro National Park gives formal protection to the giant cactus forests near Tucson, making the saguaro more than a symbol on signs and license plates. Monument Valley, located on Navajo Nation land near the Utah line, adds a different image: red sandstone buttes and open high-desert terrain that are closely associated with the interior Southwest.
Official symbols sharpen that identity into a compact fact profile. The saguaro cactus blossom is the state flower, while the cactus wren is the state bird, a pairing that reflects adaptation to arid environments rather than decorative branding alone. The palo verde is the state tree, turquoise is the state gemstone, and petrified wood is the state fossil.
Taken together, these symbols explain why desert imagery dominates public recognition, even though the state cannot be reduced to desert alone. The most accurate profile is therefore one of contrast: iconic arid-land symbols set within a state that also contains wooded uplands, cold high country, and expansive plateau terrain.
Why the extremes still set the terms
The practical consequence is that the state cannot be judged by statewide averages alone. A population figure, climate normal, export total, or tourism count becomes meaningful only when tied to place: the Phoenix metro edge, the Colorado River corridor, the border economy, or the high country that receives far more precipitation than the desert floor.
Future growth will be measured less by whether people and firms keep arriving than by whether housing, water planning, power demand, and transport capacity can keep pace in the same locations. The defining question is not whether the state is growing, but where that growth can be supported without treating scarcity as a temporary condition.
Frequently Asked Questions
Q: What is Arizona best known for?
A: Arizona is best known for the Grand Canyon, desert scenery, and extreme heat in its lower-elevation regions. Those features shape tourism, settlement patterns, and water demand across the state.
Q: Why is Arizona so dry and hot?
A: Arizona’s aridity reflects its desert and semi-desert climate, which receives limited rainfall for much of the year. Low humidity and strong solar exposure intensify daytime heat, especially in the southern lowlands.
Q: Which part of Arizona has the largest population?
A: The Phoenix metropolitan area contains the state’s largest concentration of residents. That concentration influences transportation, housing, and water planning more than any other part of the state.
Q: What are the major physical regions of Arizona?
A: Arizona is divided between desert basins and higher-elevation plateaus and mountain areas. That contrast explains why the state can shift from intense desert heat to much cooler temperatures within relatively short distances.
Q: What industries are important in Arizona?
A: Tourism, manufacturing, technology, mining, and agriculture are all important to Arizona’s economy. Their mix reflects the state’s geography, with natural attractions, urban growth, mineral resources, and irrigated farming each supporting different parts of economic activity.